


Extreme heatwaves may cross a threshold that makes them even hotter
Extreme heatwaves may cross a threshold that makes them even hotter

Eric Ralls Sun, November 15, 2026 at 10:37 PM UTC
0
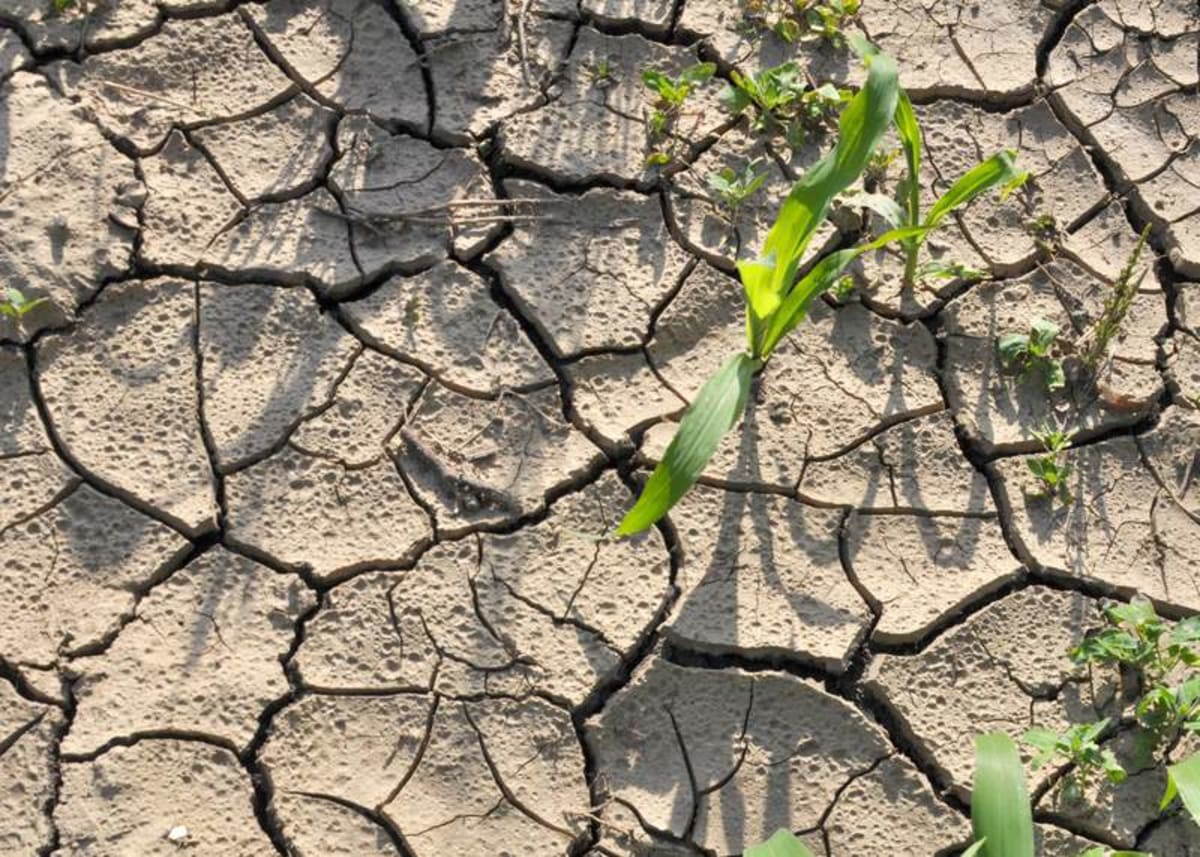
As soil dries, less water is available for evaporative cooling, allowing the ground and air above it to heat further. Credit: Shutterstock
As the planet warms, the most extreme heatwaves might be expected to warm at roughly the same rate as other hot spells.
The Pacific Northwest heatwave of 2021 beat the old record by 8.3°F (4.6°C). In parts of Europe, the hottest summer days have been warming faster than ordinary hot ones.
A new study finds a reason. Past a certain temperature, drying soil, high pressure, and the heat itself start reinforcing one another.
Where it operates, the loop supplies about a tenth of the extra heat at the peak of the most extreme heatwaves.
Heatwaves caused more than 70,000 excess deaths in Europe in 2003 and 60,000 in 2022, the authors wrote.
Yinglin Tian of the Potsdam Institute for Climate Impact Research led the work with colleagues at IIASA, Columbia University, and the Max Planck Institute of Geoanthropology.
The team trained a computer program on 45 years of weather records.
“The two-way relationship between rising temperatures and drying soils has been understood for a while and is already factored into what we expect from a typical extreme heat event,” Tian said.
“But when we look at these mega heatwaves that have been significantly outstripping previous temperature records, what we’re seeing is that once you reach a certain temperature, all three factors – drying soils, high pressure and extreme heat – begin to interact and drive each other further in a way that we haven’t understood before.”
Dry soil adds its own heat
One driver of a summer heatwave is a large, slow-moving zone of high pressure, the kind behind a heat dome. Air sinks and warms inside it, and clear skies let more sunlight reach the ground.
The other is the ground itself. Wet soil cools the air above it as water evaporates, the way sweat cools skin.
As a heatwave drags on, the soil dries out, the cooling fades, and the surface heats faster.
The records, from the Copernicus climate archive, covered every summer from 1979 to 2023. The program learned to predict the daily high, averaged over three days, from two inputs.
One was the strength of the high pressure several miles overhead, and the other the moisture in the top layer of soil.
A second technique then split each prediction into three parts. Two were the shares from high pressure alone and from soil alone.
The third captures the additional heat associated with high pressure and dry soil acting together.
A threshold switches it on
In Central Europe, the loop stayed small until the daily high climbed nearly 7°F (3.8°C) above the region’s average summer high.
Past that line, every extra degree of heat brought another tenth of a degree from the interaction.
At the peak of the 2022 Central European heatwave, the loop accounted for 13% of the extra heat. High pressure supplied 55% and dry soil 32%.
The two familiar drivers still produced most of the heat, and the loop was the extra on top. Across all the hot spots the team found, the loop’s share averaged 10%.
The hot spots covered about 15% of land in the mid-latitudes, the band that holds most of Europe and the northern United States.
The loop was strongest where summers are normally humid. Soil there starts a heatwave wet, so it can lose far more water.
In these normally humid regions, soil moisture fell rapidly during roughly the first 12 days of a heatwave.
Crossing the line more often
In Central Europe, the chance that a summer day cleared the threshold was 6% between 1979 and 1983. In 2018–2022, it was 23%.
Advertisement
The area where the loop operates grew by about 25% between the first half of the record and the second.
The loop also explained about a third of the year-to-year change in the gap between the hottest Central European days and an ordinary warm one.
High pressure and dry soil each explained less.
The pattern may help explain why Europe’s heat waves keep pushing the continent beyond its records, and why future heatwaves may do so by wider margins.
“If we’re right and this interaction is making the most extreme heat events even hotter, it means we could be in store for more severe future heatwave risks than what is currently expected,” said Kai Kornhuber, a co-author at IIASA and the Max Planck Institute of Geoanthropology.
Models get the soil wrong
The team ran the same test on 12 global climate models from the CMIP project, plus 40 runs of a single model. More than 90% of the models failed to reproduce the switch.
Above the threshold, the loop came out about 69% weaker in the models than in the weather records.
Soil moisture appears to help explain the mismatch.
At the start of a Central European heatwave, the models’ soil held about a third less water than the records showed.
It then dried at a little over half the real rate, 1.4% a day compared with 2.4%.
Soil that begins a heatwave already dry has little left to lose. The sharp drying that switches the loop on is muted, so the models miss much of the extra heat.
Where the explanation falls short
The loop is one route to extreme heatwaves, not the only one. Western North America, eastern Australia, and parts of central Africa have all warmed sharply at the top end without a strong loop.
The authors pointed to other possible causes there, including air pollution, vegetation, and terrain.
A pattern isn’t proof of cause, so the team ran independent checks.
A separately derived soil-moisture threshold matched the temperature threshold, and in a model experiment with soil moisture held fixed, the loop weakened sharply. That last test used a single model.
The main analysis also compared the three factors on the same day.
A follow-up over Central Europe found the loop still held with a three-day gap between cause and effect. The team cautioned that this check covered only that region.
The authors called for global experiments that track the three factors over time, and for climate models that represent the feedback properly.
Until then, they said, projections of the most extreme heat in the hot spots may be too low.
The full study was published in the journal Science Advances.
—–
Like what you read? Subscribe to our newsletter for engaging articles, exclusive content, and the latest updates.
Check us out on EarthSnap, a free app brought to you by Eric Ralls and Earth.com.
—–
Source: “AOL Breaking”
